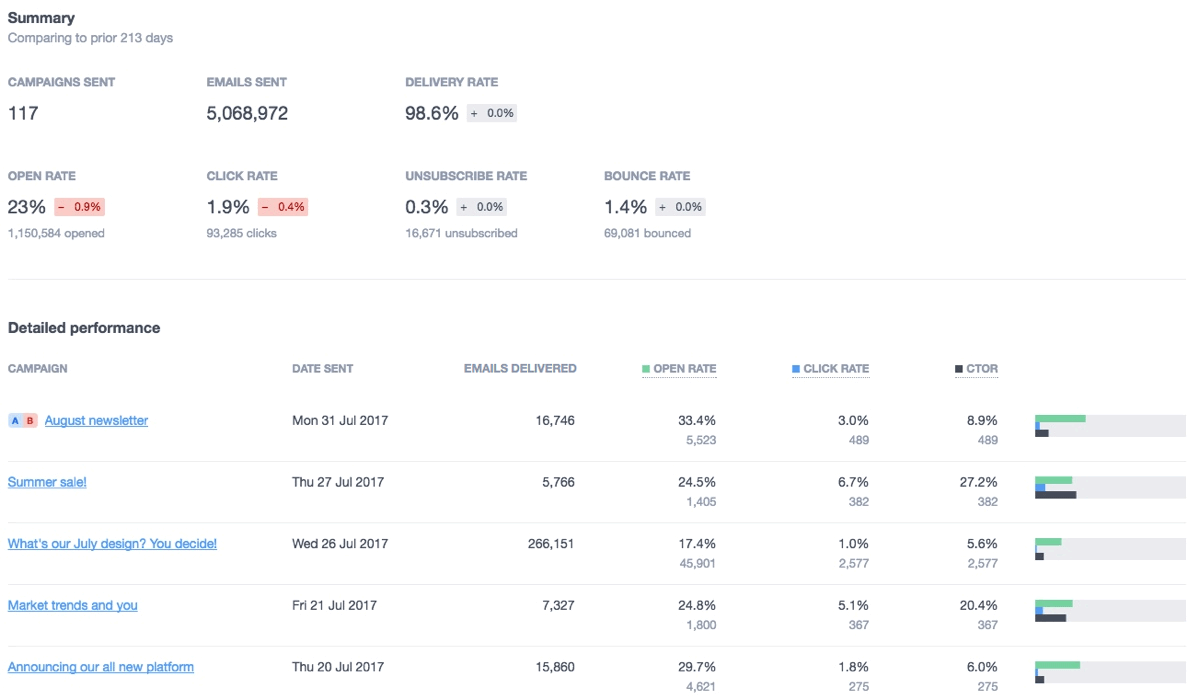
The Insights section of your account provides a powerful view into the health and performance of your email marketing.
Overall statistics can be viewed for a custom time period, up to 15 months in the past. Campaign and journey data is updated hourly, while subscriber details are updated every 24 hours.
For any selected time period, statistics are compared to the previous period of the same length. For example, if you select a 120 day period, performance is compared to the 120 days prior to that time period. This is useful for month on month, quarter on quarter, or year on year reporting.
Set a date range
To view statistics over a custom date range:
- Click Insights.
- Click the left date in the date range box to set your start date, then select your end date. You can change just the end date by clicking the date on the right side of the date range box.
- Select the statistics to view for that date range using the menu on the left.
Download data
To download the data on the insights page you're currently viewing as a CSV file, click the down arrow near the top right.

Statistics
Insights are available for regular and A/B campaigns, automation, content, lists, segments, and engagement. Hover your cursor over a metric to see how it is calculated.
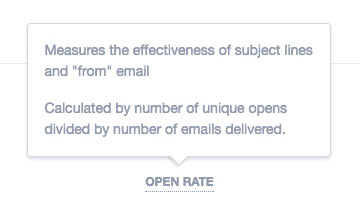
To see how all metrics are calculated, refer to the tables below.
Content
In the "Content" section, you can see how individual links perform in your emails. Each row in the "Detailed performance" report includes a link's Call to Action (CTA) — for example, a button label, or text the link is applied to. If the link belongs to an image, the CTA is shown as "View image", which can be clicked to see the image.
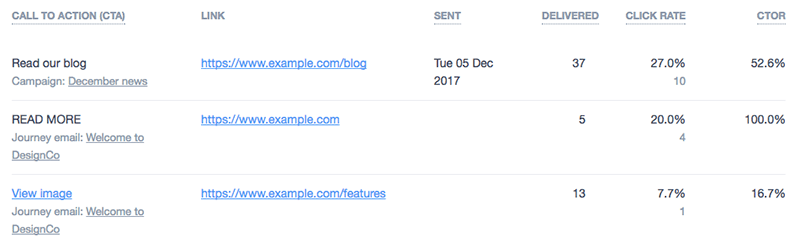
You can click on an email's name, below each CTA, to open its full report.
There are a few things to take into account when looking at the content report:
- If you change a CTA or link when you save a new version of a journey email, it will be shown in a new row — the data does not roll over from the old CTA/link.
- We may not be able to retrieve CTAs for journey emails saved before January 2018. In this case, you'll see the following entries:
- If the CTA of a link is unknown, but its link is unique in the email, it will be shown as N/A.
- If the CTA of a link is known, and there are unknown CTAs with the same link in the email, their stats will be rolled into the known CTA entry.
- If there are multiple known CTAs, and at least one unknown CTA all with the same link, their stats will be rolled into an entry named "Multiple".
Engagement
In the "Engagement" section, you can track how engaged subscribers are in your lists, as well as how engaged people are across your most commonly emailed domains.
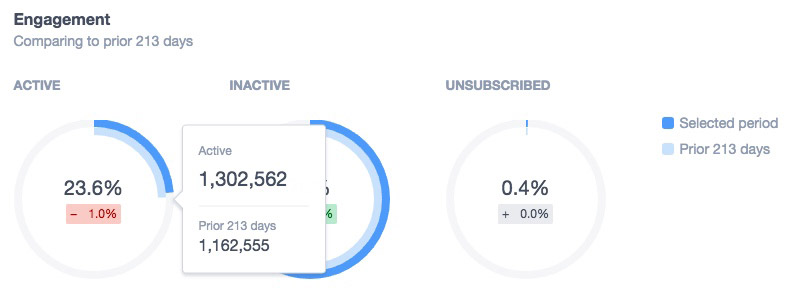
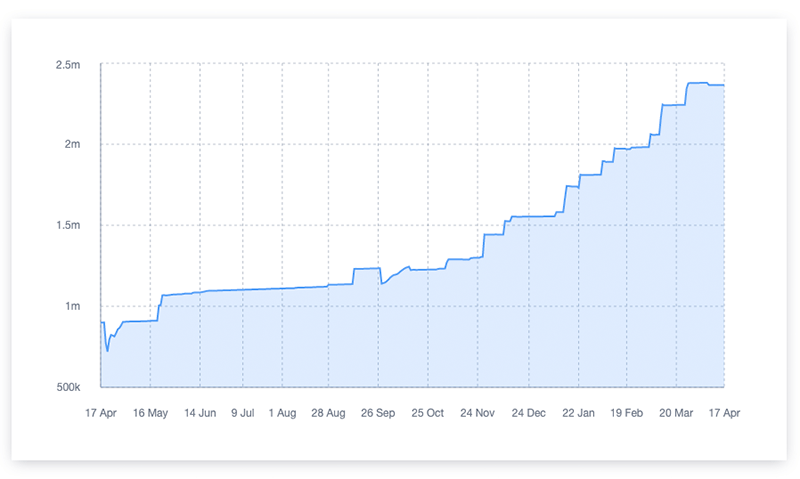
Active vs inactive subscribers
In the "Engagement" section of insights, you can view your active and inactive subscribers. Active and inactive are defined as follows:
- Active — any subscriber who you sent an email in the last 30 days, who has opened an email from you in the last 90 days.
- Inactive — any subscriber who you sent an email in the last 30 days, who has not opened an email from you in the last 90 days.
To see the exact number of active and inactive subscribers, hover your mouse cursor over the chart.
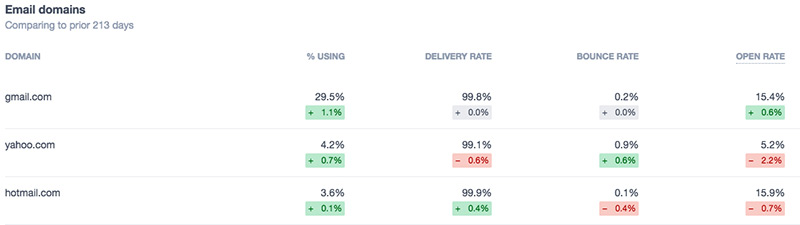
Email domains
Below the engagement charts, you can see the delivery, bounce and open rates for the top 10 email domains you are sending to, for example, gmail.com, yahoo.com, and hotmail.com.
Lists
In the "Lists" section, you can see how the lists you've sent to during the selected time period have performed. You can also see how their subscriber count has changed during that time. Subscriber counts are calculated at 0:00UTC each day.
How metrics are calculated
How metrics are calculated depends on what area of insights you are viewing.
Core numbers
How the base statistics are calculated for the selected time window.
| Metric | Calculation |
| Campaigns sent | The number of campaigns sent |
| Emails sent | The total number of emails sent |
| Emails delivered | The total number of emails sent, minus the total number of emails bounced |
| Emails bounced | The number of emails bounced |
| Emails unsubscribed | The total number of unsubscribes |
| Emails opened | The total unique opens for all emails |
| Emails clicked | The total unique clicks for all emails |
Campaigns
How the statistics are calculated for the selected time window in Campaigns.
| Metric | Calculation |
| Delivery rate | (Total emails sent - Total emails bounced) ¸ Total emails sent |
| Open rate | Unique opens ¸ Total delivered |
| Click rate | Unique clicks ¸ Total delivered |
| Click to open rate (CTOR) | Unique clicks ¸ Unique opens |
| Unsubscribe rate | Total unsubscribes ¸ Total delivered |
| Bounce rate | Total bounced ¸ Total sent |
| Emails delivered | The total number of emails sent, minus the total number of emails bounced |
| Subject line * | The subject line for each campaign |
| Total sent * | The total number of emails sent per campaign |
| Total opens * | The total number of email opens per campaign |
| Total clicks * | The total number of clicks per campaign |
| Total bounces * | The total number of emails bounced per campaign |
| Total unsubscribes * | The total number of unsubscribes per campaign |
* Available in CSV download only.
Automation
How the statistics are calculated for journeys that sent an email during the selected time window.
| Metric | Calculation |
| Active journeys | Number of journeys that are active, and sent an email during the date range specified |
| Emails sent | Number of emails sent by journeys |
| Delivery rate | (Total sent - Total bounced) ¸ Total sent |
| Open rate | Unique opens ¸ Total delivered |
| Click rate | Unique clicks ¸ Total delivered |
| Click to open rate (CTOR) | Unique clicks ¸ Unique opens |
| Unsubscribe rate | Total unsubscribes ¸ Total delivered |
| Bounce rate | Total bounced ¸ Total sent |
| Recipients | Number of subscribers who were sent a journey email |
| Total sent * | The total number of emails sent per journey |
| Total opens * | The total number of email opens per journey |
| Total clicks * | The total number of clicks per journey |
| Total bounces * | The total number of emails bounced per journey |
| Total unsubscribes * | The total number of unsubscribes per journey |
* Available in CSV download only.
Content
How statistics are calculated for all subscribers who were sent an email during the selected time window.
| Metric | Calculation |
| Total clicks | The total number of clicks across all links for campaign and journey emails during the selected time window |
| Total unique clicks | The total number of unique clicks across all links for campaign and journey emails during the selected time window |
| Click rate (in summary) | Unique clicks divide by the total number of campaigns and journey emails delivered during the selected time window |
| Delivered | Total sent - Total bounced for the email containing the link |
| Click to open rate (CTOR) | Link unique clicks ¸ Unique opens for emails containing the link |
| Click rate (per link) | Link unique clicks ¸ Total number of emails delivered containing the link |
Lists
How statistics are calculated for lists that were sent to during the selected time window.
| Metric | Calculation |
| Subscribers | Total subscribers in the list as of the latest date in the date range |
| Emails delivered | Total sent - Total bounced, sent to subscribers in a list |
| Open rate | Unique opens ¸ Total delivered |
| Click rate | Unique clicks ¸ Total delivered |
Segments
How statistics are calculated for segments that were sent to during the selected time window.
| Metric | Calculation |
| Subscribers | Total subscribers in the segment as of the latest date in the date range |
| Emails delivered | Total sent - Total bounced sent to segments for:
|
| Open rate | Unique opens ¸ Total delivered |
| Click rate | Unique clicks ¸ Total delivered |
Engagement
How statistics are calculated for all subscribers who were sent an email during the selected time window.
| Metric | Calculation |
| Total recipients | Total sent - Total bounced |
| Emails sent | Total number of emails sent |
| Open rate | Unique opens ¸ Total delivered |
| Click rate | Unique clicks ¸ Total delivered |
| Unsubscribe rate | Total unsubscribes ¸ Total delivered |
| Bounce rate | Total bounced ¸ Total sent |
| Active | Subscribers who were sent an email and opened it ¸ Subscribers who were sent an email (over a 90 day rolling timeframe) |
| Inactive | Subscribers who were sent an email and did not open it ¸ Subscribers who were sent an email (over a 90 day rolling timeframe) |
| Unsubscribed | Subscribers who were sent an email then unsubscribed ¸ Subscribers who were sent an email (over a 90 day rolling timeframe) |
| Email domains | The number of subscribers who were sent an email on a certain domain ¸ The number of subscribers who were sent an email |